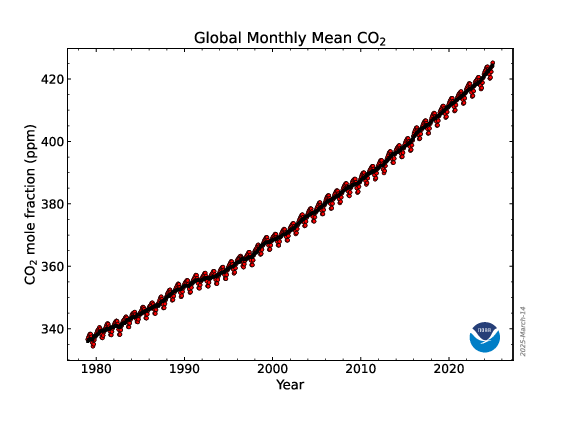
In the atmosphere was around 382.90 ppm CO2, 102.9 ppm higher than preindustrial levels.

| year | mean CO2 / ppm |
| pre-industrial | 280 |
| 1940 | 311.3 |
| 1941 | 311.0 |
| 1942 | 310.7 |
| 1943 | 310.5 |
| 1944 | 310.2 |
| 1945 | 310.3 |
| 1946 | 310.3 |
| 1947 | 310.4 |
| 1948 | 310.5 |
| 1949 | 310.9 |
| 1950 | 311.3 |
| 1951 | 311.8 |
| 1952 | 312.2 |
| 1953 | 312.6 |
| 1954 | 313.2 |
| 1955 | 313.7 |
| 1956 | 314.3 |
| 1957 | 314.8 |
| 1958 | 315.34 |
| 1959 | 316.18 |
| 1960 | 317.07 |
| 1961 | 317.73 |
| 1962 | 318.43 |
| 1963 | 319.08 |
| 1964 | 319.65 |
| 1965 | 320.23 |
| 1966 | 321.59 |
| 1967 | 322.31 |
| 1968 | 323.04 |
| 1969 | 324.23 |
| 1970 | 325.54 |
| 1971 | 326.42 |
| 1972 | 327.45 |
| 1973 | 329.43 |
| 1974 | 330.21 |
| 1975 | 331.36 |
| 1976 | 331.92 |
| 1977 | 333.73 |
| 1978 | 335.42 |
| 1979 | 336.85 |
| 1980 | 338.91 |
| 1981 | 340.11 |
| 1982 | 340.85 |
| 1983 | 342.53 |
| 1984 | 344.07 |
| 1985 | 345.54 |
| 1986 | 346.97 |
| 1987 | 348.68 |
| 1988 | 351.16 |
| 1989 | 352.79 |
| 1990 | 354.06 |
| 1991 | 355.39 |
| 1992 | 356.09 |
| 1993 | 356.83 |
| 1994 | 358.33 |
| 1995 | 360.17 |
| 1996 | 361.93 |
| 1997 | 363.04 |
| 1998 | 365.70 |
| 1999 | 367.79 |
| 2000 | 368.96 |
| 2001 | 370.57 |
| 2002 | 372.58 |
| 2003 | 375.14 |
| 2004 | 376.95 |
| 2005 | 378.98 |
| 2006 | 381.15 |
| 2007 | 382.90 |
| 2008 | 385.02 |
| 2009 | 386.50 |
| 2010 | 388.75 |
| 2011 | 390.62 |
| 2012 | 392.65 |
| 2013 | 395.40 |
| 2014 | 397.34 |
| 2015 | 399.65 |
| 2016 | 403.07 |
| 2017 | 405.22 |
| 2018 | 407.61 |
| 2019 | 410.07 |
| 2020 | 412.44 |
| 2021 | 414.70 |
| 2022 | 417.08 |
| 2023 | 419.35 |
| 2024 | 422.77 |
Data from 1975 to 2024 sourced from NOAA globally averaged marine surface annual mean data (Lan, X., Tans, P. and K.W. Thoning: Trends in globally-averaged CO2 determined from NOAA Global Monitoring Laboratory measurements. Version 2025-03).
Data from 1940 to 1974 sourced from Goddard Institute for Space Studies (Sato and Schmidt: Forcings in GISS Climate Model, 2004 dataset)
Pre-industrial level sourced from NOAA (Lindsey: Climate Change: Atmospheric Carbon Dioxide)